- June 25, 2015
- 0 Comments
- In Existing Building Performance
- By Heather Breslin
According to the Institute for Market Transformation, fourteen cities, two states, and one county in the U.S. now have energy benchmarking and transparency policies in place for large buildings. This means that continually more cities and jurisdictions will have an understanding of how their buildings perform. It also means that these policies and their outcomes can be compared against each other and ultimately improved.
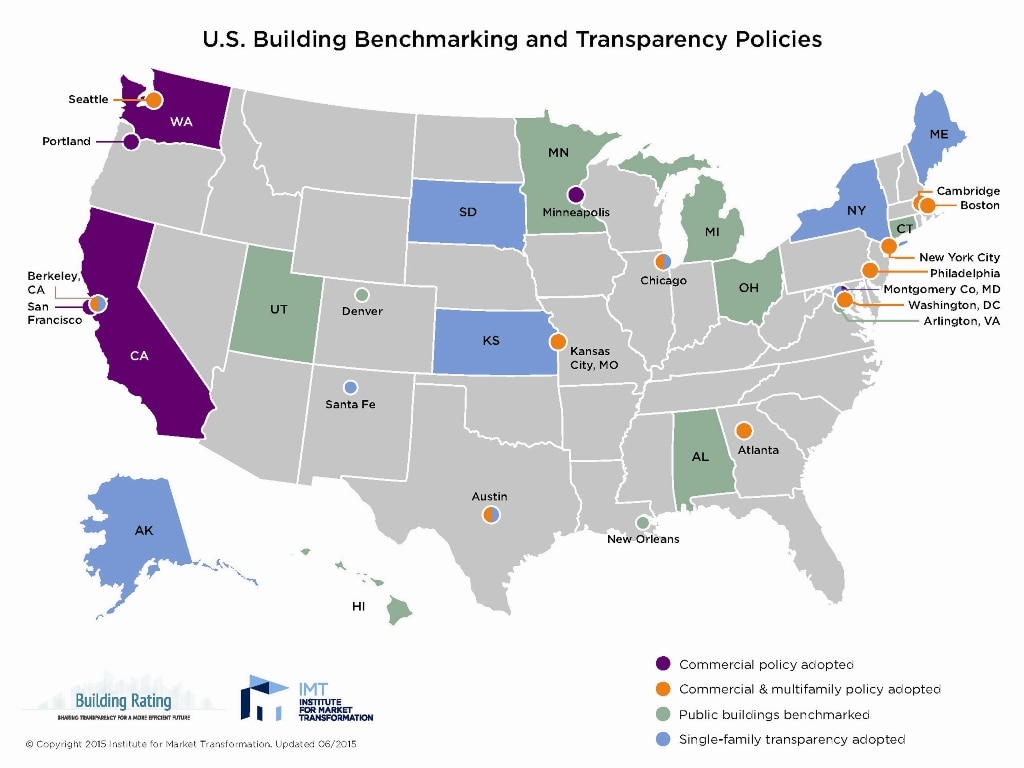
14 cities, 2 states, and 1 county in the U.S. now have benchmarking and transparency policies in place for large buildings.
With these improvements in the policy landscape impacting the built environment, the question was asked: How can the data be analyzed, and what impacts do the policies themselves have on building energy usage, greenhouse gas emissions, and the local economies?
At the end of May the Department of Energy (DOE) published the DOE Benchmarking & Transparency Policy and Program Impact Evaluation Handbook, which provides “cost-effective, standardized analytic methods for determining gross and net energy reduction, greenhouse gas (GHG) emissions mitigation, job creation and economic growth impacts” for jurisdictions that operate benchmarking policies.
Also released in May was the New York City Benchmarking and Transparency Policy Impact Evaluation Report which utilized real NYC data using the same methodologies.
SWA worked with the Navigant Consulting and DOE teams to review data from two jurisdictions and develop methodologies for analysis.
The general findings of the research team were:
- Data quality improved and volume increased as each year passed and as more building owners and consultants familiarized themselves with these policies.
- Smart criteria must be in place to determine which data should and should not be included in any analysis. “Bad” (erroneous or incomplete) data can skew results and results in either overly positive or negative energy performance, and eliminating it is a crucial first step in any data analysis effort.
We then developed methodologies on how to best analyze:
- Whether and by how much energy usage is changing in buildings
- How greenhouse gas emissions change over time
- The economic impact of potential job creation that results from the effort needed to improve the efficiency of buildings as energy usage drops.
In New York City’s case, the team found that energy usage has dropped each year Local Law 84 (NYC’s benchmarking legislation) has been in place, and as a result, economic activity has increased. The analysis also saw related drops in greenhouse gas emissions, as well as a large shift away from heavy oils to natural gas as a result of the city’s #6 oil ban (Local Law 43).
We look forward to more feedback from practitioners and jurisdictions, and seeing more data as more cities implement energy benchmarking policies. The opportunity to apply these methodologies to new sets of data and review outcomes can only improve the policies themselves and understand their impact across the country.
More information and the reports are available at: http://energy.gov/eere/buildings/articles/doe-resources-help-measure-building-energy-benchmarking-policy-program